external: index
in-page: vmap-map from-GSHHS from-VMAP0 comb-VMAP0 from-ERSI combined Google Microsoft FG scenery
A recent discussion on the development board about some world 'shapes' from the recent FlightGear World Scenery 1.0.0 update caused me to take another look at TerraGear, specifically how it deals with the VMAP0 database ...
The folder TerraGear/src/Prep/TGVPF contains an application tgvpf which reads vmap0 data, and generates polygons from it, as explained in the TerraGear README ... So, as a first step I set out to build this application ....
This required a number of prerequisites to be built first, then I eventually had a tgvpf application, well I called it vmap.exe, ready to run ...
The prerequisites are :-
In TerraGear itself - src\Lib\Geometry, src\Lib\Polygon, and src\Lib\vpf
External : SimGear (with all its dependences), PLIB, and gpclib
For MSVC8, I had to add a preprocessor define, HAVE_CONFIG_H , and drop a small patch into many of the source files, namely :-
#ifdef HAVE_CONFIG_H
# include <config.h>
#endif
And in this config.h file, like the one for Lib/Polygon, put the code -
// config.h - for Lib/Polygon
#ifndef  _config_H_
#define  _config_H_
#ifdef   UNICODE
#undef   UNICODE
#endif
#ifdef   _UNICODE
#undef   _UNICODE
#endif
#pragma warning(disable:4996)
#endif  _config_H_
// eof - config.h
Unfortunately it seems in some case MSVC8 defaults to UNICODE being ON, that is using WIDE character set, and this invokes the WIDE (W) functions, while everything in TerraGear code is a simple 'char' ...
Further, rather than directly running tgvpf.exe, using the supplied process.sh, I added a front end, vmap.exe, to setup various command lines to pass to tgvpf. The first I chose is one commented out of process.sh, and that was to get the 'boundaries' ... just to see what these look like ... I know, curiosity killed the cat, but to me the cat has 9 lives, so why not ...
Be aware, the runtime is LONG, at least in the Debug version I started with. Over 2-3 hours on the first run, and it has a LOT of output to the console ... maybe things will much faster using the Release configuration ... however, on my first run, I get a Debug assertion, and abort near the end ...
But not until after it had written some 32,000 files, in some 5,255 folders of the form -
$(WORKBASE)\VPF-LandMass\w010n60\w008n62\2827776.18
Thirty-two THOUSAND of them ... YOWEE ...
And each has the internal form like -
#2D
Default
1
59
0
-7.590944449106853  62.121452331542969
-7.585083325703939  62.121322631835938
-7.579222202301025  62.121192932128906
... etc, etc, etc ...
I will have to work out later what all this is ;=)) and maybe convert it into say a GSHHS database type file, or something else for easy comparisons ...
I decide to concentrate on a single world block that includes Hong Kong. I am somewhat familiar with this region, having lived there for lots of years, but more importantly Hong Kong is made up of over 100 islands, and I decide this will be a good 'test' ... This is world chunk, --chunk=e110n20 ...
And as a later comparison, I download the 10x10 World Scenery 1.0.0, e110n20.tgz, 110MB, from - http://www.flightgear.org/Downloads/scenery-1.0.0.html -, the graphical interface ... this took some 30 minutes, at a throughput of 60.4KB/sec ... sometimes my internet access is very fast for small files, but this, on average throughput is about the best I see for large files downloaded by FTP ...
But, when I add the above --chunk=e110n20 I get NO FILES output ??? What is happening ... that was using -
Database path: C:\FG\vmap0\v0eur\vmaplv0
Library name: eurnasia
Coverage name: bnd
Feature name: polbnda
Working directory: C:\FG\tempvpf2\VPF-LandMass
Material type: Default
Bounds: lat,lon Max 30.000000,120.000000, Min 20.000000,110.000000 ...
Searching through 5847 topologies ...
Maybe I want 'coastl', not 'polbnda' ... no, still got nothing, although there were some 6248 topologies ... what am I missing here? ... try for all the coast lines ... Zoot! That worked ;=)) It ran for nearly an HOUR, and write some 18,312 files, in 4,682 folders, about 62MB of data ...
I decide to remove some of the console output, which comes from Polygon.lib, chop-bin.cxx, where a 'normal' cout was being done ... and build the Release version ... and on another run using the Release configuration, and without lots of console output, it completes in just 3.1 minutes !!! WHAT A DIFFERENCE NO DEBUG MAKES ;=))
I still get a few "Intersection: coincident lines" and "Intersection: parallel lines", but these are put out through SG_LOG(SG_GENERAL, SG_ALERT, ...), so leave these for now.
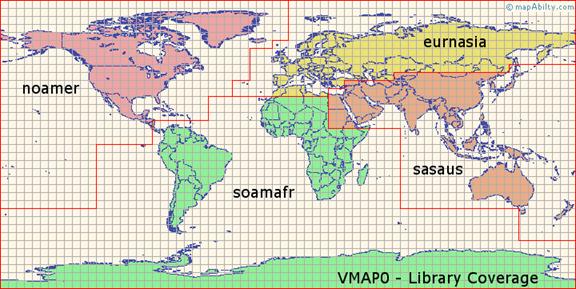
Of course, I eventually see why the chunk e110n10 outputs nothing above. The only 'e110' folder created is e110n70. In fact there are NO 'n10' folders. Maybe this information is in another of the main vmap0 database sets? ... YUP, from the graphic -
This shows clearly that Hong Kong, the chunk I am using is in 'sasaus' - I should have guessed 'South Asia' = 'sa' ;=(). Using Release, and switching to this database, I get 646 files, in 74 folders, 2.4MB of data, done in just 6 seconds ... things are starting to HOP ;=))
Now comes the question of how to VIEW these 646 files? I did read about a VPFView application, but this directly accesses the vmap0 data ... that is not exactly what I want. I want to compare this information to say GSHHS data. So maybe I can coach fgvpf to output a GSHHS database file, instead of, or as well as, the current file crop ...
Of course, tgvpf generates a polygon from each feature, and splits that polygon up into 'buckets' ... thus if a feature spans several buckets, it is split ... this I do not need for GSHHS ... in fact do I even need to generate a polygon for each feature? This is done in tgChopNormalPolygon(), in chop-bin.cxx, part of the src\Lib\Polygon ...
So I am sort of faced with the question - should I try to convert the VpfFeature (class), which tgvpf extracts from the database, or continue to work with TGPolygon shape, which tgvpf then uses to pass to tgChopNormalPolygon(work_dir, material_type, shape, false)?
To 'see' more of what is happening, I elevated the sg_log to SG_DEBUG if under debug -
                                                // Enable logging.
#if   (defined(_DEBUG) && !defined(NDEBUG))  // _MSC_VER
  sglog().setLogLevels( SG_ALL, SG_DEBUG );
#else
  sglog().setLogLevels( SG_ALL, SG_WARN );
#endif
This pointed out a small error in SimGear newbucket.hxx. I amended the -
inline ostream& operator<< ( ostream& out, const SGBucket& b ) {
    return out << b.lon << ":" << b.x << ", " << b.lat <<":" << b.y;
}
to
inline ostream& operator<< ( ostream& out, const SGBucket& b ) {
    return out << b.lon << ":" << (b.x + 0x30) << ", " << b.lat << ":" << (b.y + 0x30);
}
since x and y are the binary (char) values 0 - 7, which I now hope will show as numbers ... this required rebuilding SimGear.lib (Debug and Release) by running my fgfs.sln, then TG Polygon.lib, and finally my vmap ...
However while this produced a slightly 'better' number display, it is still WRONG-
  Bucket min = 119:50, 26:53
  Bucket max = 119:50, 26:54
so some other conversion is taking place??? This is minor, and had already tried + '0', but I try one more way ;=))
inline ostream& operator<< ( ostream& out, const SGBucket& b ) {
    return out << b.lon << ":" << (int)b.x << ", " << b.lat << ":" << (int)b.y;
}
and this gets the desired output -
  min = 119.581, 26.7491, 200 max = 119.608, 26.7762, -200
  Bucket min = 119:2, 26:5
  Bucket max = 119:2, 26:6
But which way to go? Directly use the VpfFeature feature, or the TGPolygon shape? Of course, if the 'shape', then without splitting it into SGBuckets ...
There is already a commented out -
    write_polygon(shape, "temp.shape");
    write_polygon(result, "temp.result");
so I decide to try these, and see what is written ... but write_polygon(...) is an unresolved external ... where is this declared?
Ok, this is in <TG>\src\Lib\Output\output.cxx, another library to build ... but it is only one source file, and is built in no time at all ... link it into my vmap application, and write and examine the first set ...
The temp.shape0 contains a first line of 'hole = 0', and lon, lat entries, with the last being the same as the first, like ...
hole = 0
119.60793338 26.76926203
119.60614301 26.76676921
119.60435264 26.76427639
... many more ...
119.60629045 26.77622470
119.60711191 26.77274336
119.60793338 26.76926203
While the temp.result0, start with the first 'hole' number line, but only has 8 entries, like
hole = 0
119.59083549 26.74908505
119.58842992 26.74964688
119.58691796 26.75000000
119.58891444 26.75000000
119.59071359 26.74957981
119.59128080 26.75000000
119.59207056 26.75000000
119.59083549 26.74908505
This change, and reduction, is done in result = tgPolygonInt( base, shape );, which in turn does - polygon_clip( POLY_INT, subject, clip ); The results are smaller, and have modified lon, lat values. I guess this answers my question ...
If I want to compare VMAP0 data to GSHHS data, then maybe I should be using the shape, rather than the modified, changed, and reduced TG result, even if I fully understood exactly what gpclib is doing here ...
Further, maybe my GSHHS output could be added to Output.lib, where it either creates a new GSHHS database file if none exists, or appends this 'shape' to such a file, potentially adjusting the header to match the new extents of this polygon ...
Well I can add it to Output.lib later, maybe, but for immediate results, and easy debugging, then I will add such an vmap2gshhs.[cxx|h] directly to my vmap application ...
Ok, that was surprisingly easy. In almost no time at all I had written a vmap2gshhs.b database for the --chunk=e110n20, since I had most of the code already in my gshhs_win application (http://geoffair.net/fg/gshhs-01.htm) ...
And of course, using my gshhs_win application it was easy to prepare a visual comparison ;=))
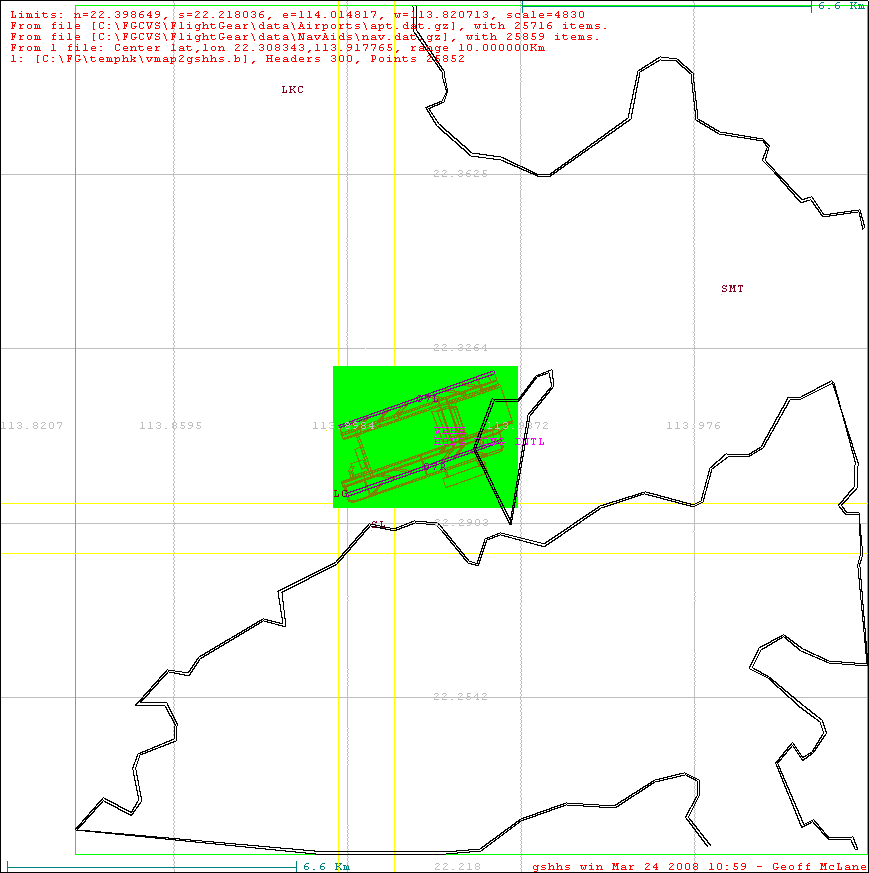
2. Using VMAP0 dataset, converted to GSHHS data -
Well, they certainly 'look' similar ;=)) But we can see the VMAP0 data is 'grainier' ... that is, it does not have the same resolution as the GSHHS data, and the very small islands are missing. But, I can only assume the VAMP0 data has perhaps high and low water lines, thus is a set of almost 'parallel' coast lines ...
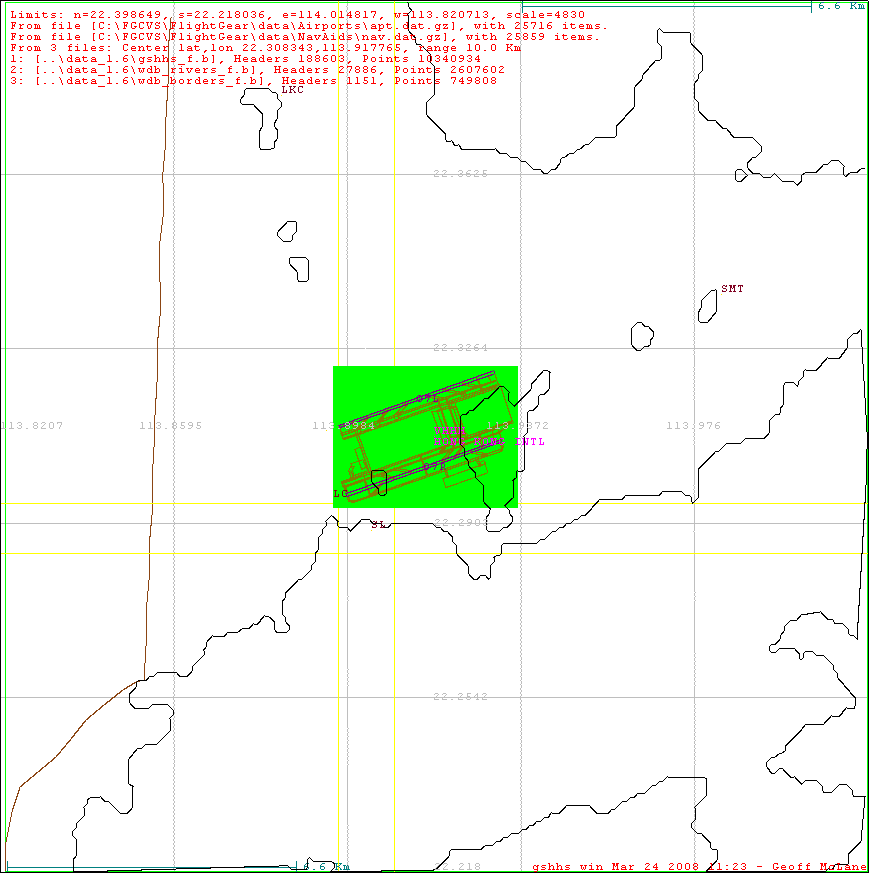
Now to extract MORE VAMP0 features, and add them to this, or another GSHHS database, and do other comparisons ... like the GSHHS shows the 'border' between Chinese water, and the HKSAR. Is the same border available in VMAP0. So I switch back to 'bnd', 'polbnda', and then 'rivers', and write a new GSHHS databases ... But the HKSAR boundary does not appear, BUT the political boundaries seems to exactly match the coastline ???
It is not very clear on this small image, but the boundaries are pained in brown, and they thus sort of fill in the coastline (black) ... HUH???
Then, in some more discussion on the development board, I am pointed to some MORE shoreline
data, maintained by Environmental Systems Research Institute (ERSI) :-
http://www.nga.mil/portal/site/nga01/index.jsp?epi-content=GENERIC&itemID=9328fbd8dcc4a010VgnVCMServer3c02010aRCRD&beanID=1629630080&viewID=Article
From the ERSI site map -
I download shapefile23.zip, and unpacked it. Now to understand this format ... so I begin reading - http://www.esri.com/library/whitepapers/pdfs/shapefile.pdf - from ERSI ... this has a very details technical description, but maybe I can also find some code ... Of course, TG has src\Lib\shapelib ... so I decide to build this library ... there is even a shp_api.html to read ... so, using this 'shapelib', I added the capability of dumping a 'shape' file to my Dump4 console application! Piece of cake ;=))
And later I found the source online, at http://dl.maptools.org/dl/shapelib/. Here version shapelib-1.2.10.tar.gz, 167219 Apr 07 2003 09:12:04 can be found ... and for example comparing shpopen.c, TG contains version 1.2, circa 1999-2000, while this tar.gz contains version 1.39, circa 2002, and although a code compare shows 'lots' of changes, I was not able to easily spot anything significant.
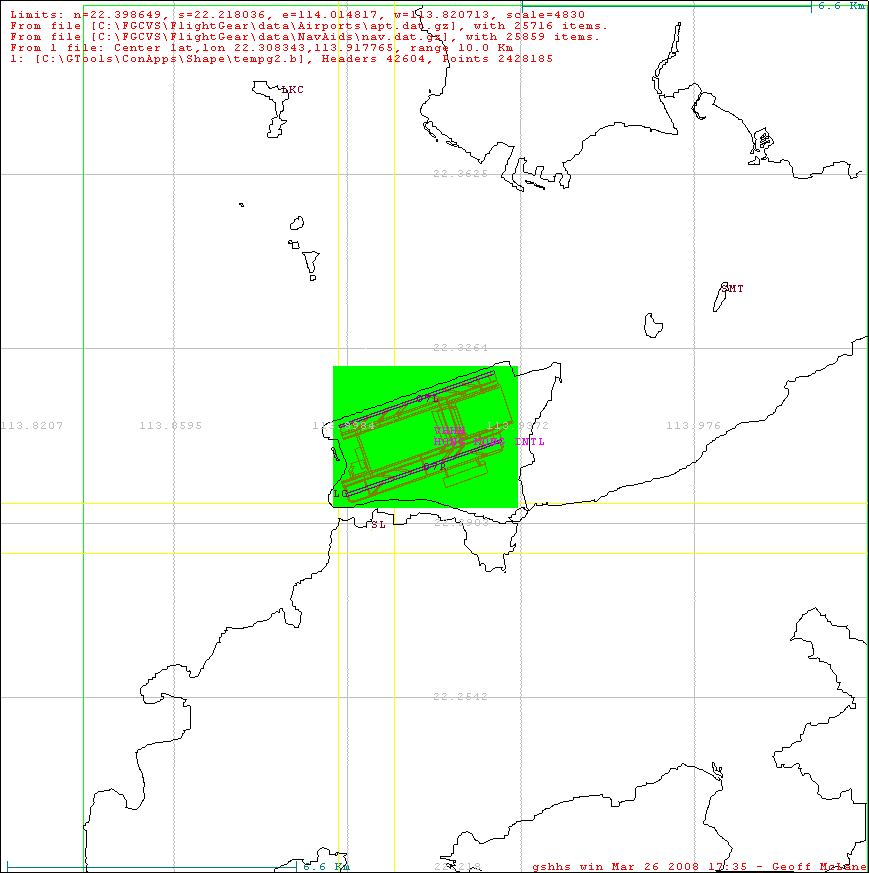
What about outputting ERSI also as a GSHHS file? Then I could generate the above again using this ERSI data, and 'see' the difference ... so I write a quick 'shape' application to do this, then run my gshhs_win to generate the image, AND WOWEE, WHAT A DIFFERENCE ;=))
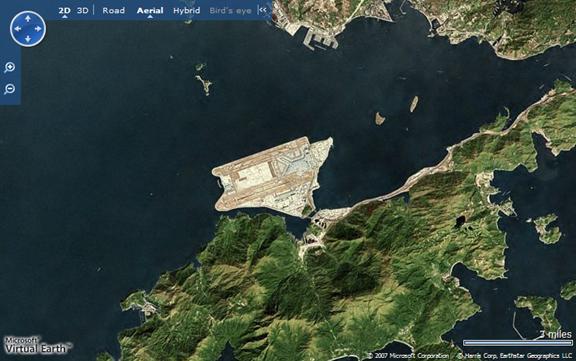
We can see this ERSI shapefile, gives a really detailed view. It even shows the filled in area that makes up the airport. That is the filled out Chek Lap Kok island that now makes up the airport area ...
My initial application to extract shapefile data, and write a GSHHS database took HOURS. That was because I was opening the GSHHS data file for each new record, and then reading to the end, to get the next block 'id'. I have now created a clsGSHHS class, and open the file at the beginning, write each ERSI record, then only at the end, close the new GSHHS database file. This reduce the operation to 'minutes', even in Debug configuration mode ;=))
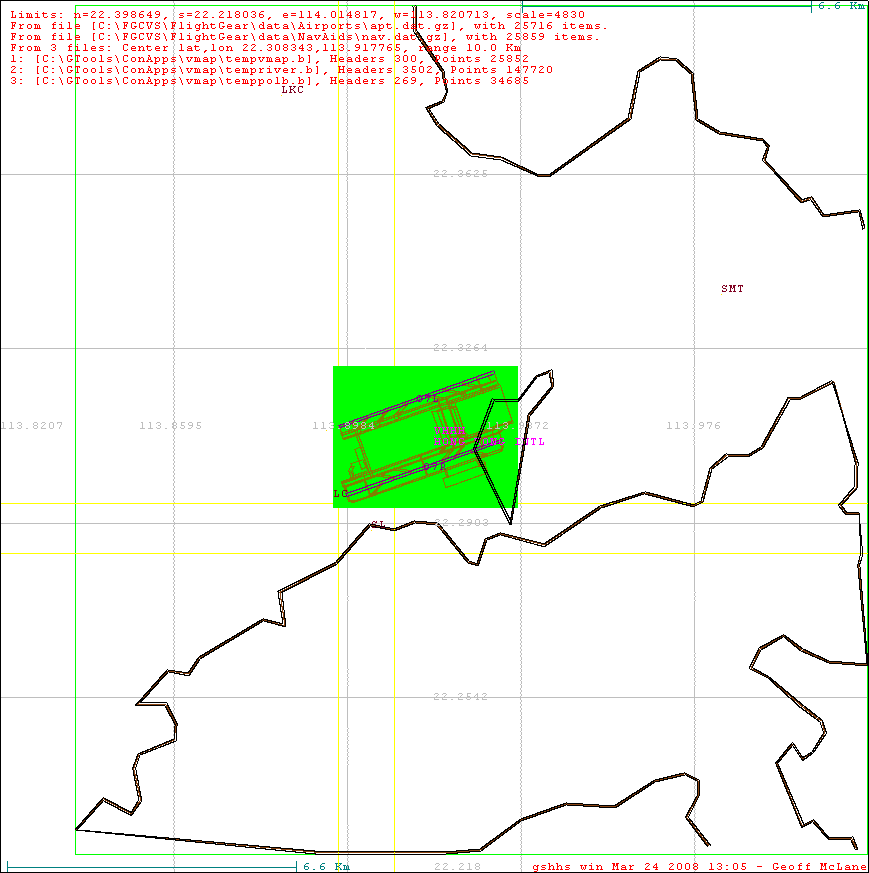
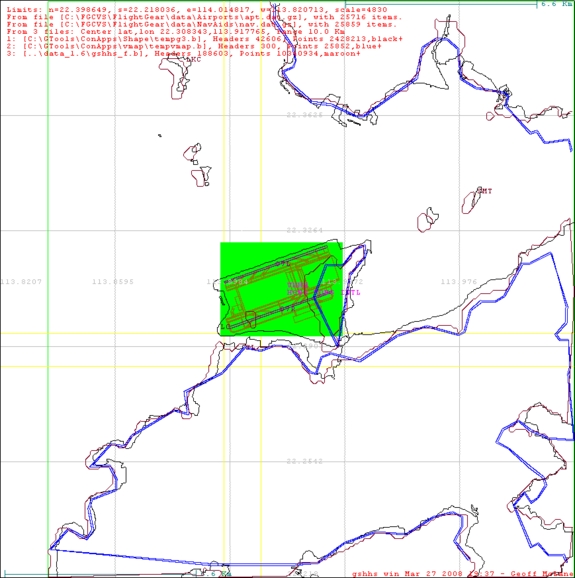
So now I have THREE(3) forms of GSHHS data - 1. the original 1.6 data, 2. that extracted from VAMP0, and now 3. that extracted from ERSI ... If I combine all three into one image, I should be able to 'see' any 'difference' ... of course, I am only using a very crude lat, lon to pixel conversion, like -
int pixlat = convlat( lat );
int pixlon = convlon( lon * cos(lat));
But I think this crude 'conversion' will get things relatively correct, and anyway, it is equally applied to each dataset ... YEEK, there are certainly some differences between the database ;=(). The black is the ERSI, the blue VMAP0, and the maroon GSHHS ... although they do almost travel the same path ...
These do closely resemble the fantastic Google view -
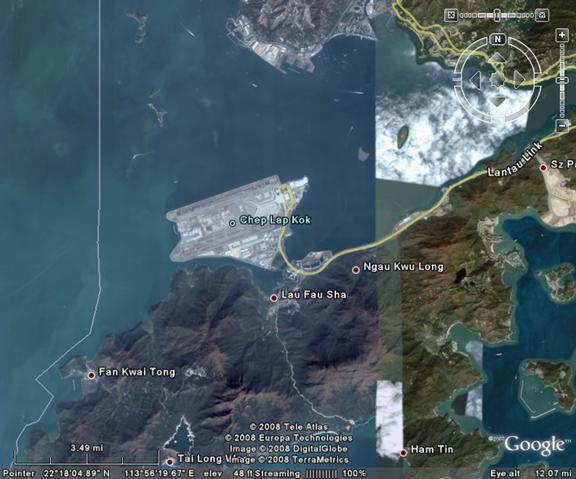
And that offered by Microsoft Virtual Earth ... http://dev.live.com/virtualearth/sdk/
It almost gets to the point where there are TOO MANY options to choose from, but this set of view certainly give me a better understanding of FlightGear scenery generation.
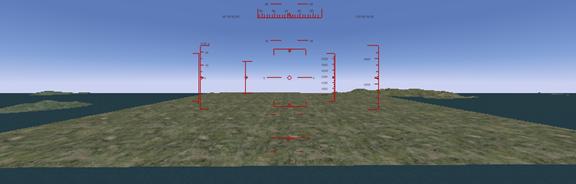
Finally how does it look in FlightGear? ... I unpack the e110n20.tgz in to my <work>/data/Scenery folder, and fire up the trusty UFO over Hong Kong ... at first I attempt to climb high enough to get the correct view, but ran into the other problem I read about recently - a sort of 'white-out' over about 60,000 feet ... so I stop at about 55,000 ...
And then use the 'X' key to zoom out - increase the FOV ... and NOW I can see what is wrong with the current scenery ;=(( some 'rectangle' has filled in most of the water ??? Not good at all ;=((
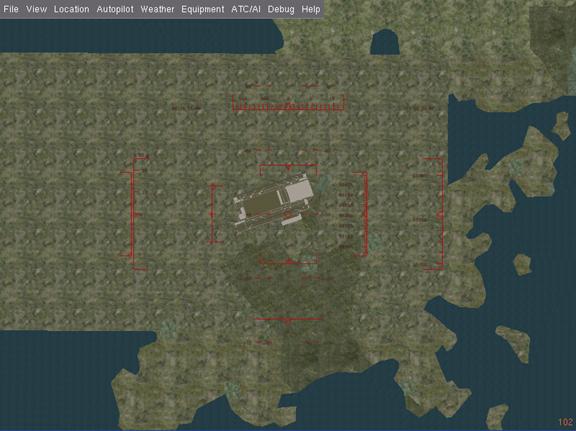
And that rectangle of earth-which-should-not-be stretches half way to Macau ;=)) It is obviously a glitch in the scenery generation tool ...
We can only hope this e110n20.tgz 'chunk' is regenerated, and replaced soon ...
The point made in the development discussion, that rivers will not always meet the shoreline if you use GSHHS data for the shorelines, and VMAP0 for the rivers is already apparent in the combined image above ... How to overcome this, since it seems important to use GSHHS, if not ERSI for 'true' coastline image generation ...
But the other idea put forward concerning coastlines, was that while GSHHS is better than VMAP0, VMAP0 was still better for some inland water bodies (lakes and maybe rivers) ... This is still to be checked and shown by me ...
I must try more checks, when I get the chance, and maybe blend in SRTM data as well ...
March 28, 2008.
EOF - TG-04.doc